|
|
| ITP Scientist Released Preliminary Result for Rupture Process of Apr. 25, 2015, Mw7.9 Earthquake, Lamjung, Nepal |
On April 25,2015, a magnitude Mw7.9 earthquake occurred near the southern Himalaya, Nepal, at 14:11(Beijing time, UTC 2015-04-25 06:11:26) with an epicenter at 28.147°N 84.708°E and a source depth of 15 km determined by the United States Geological Survey(USGS) (Fig. 1). 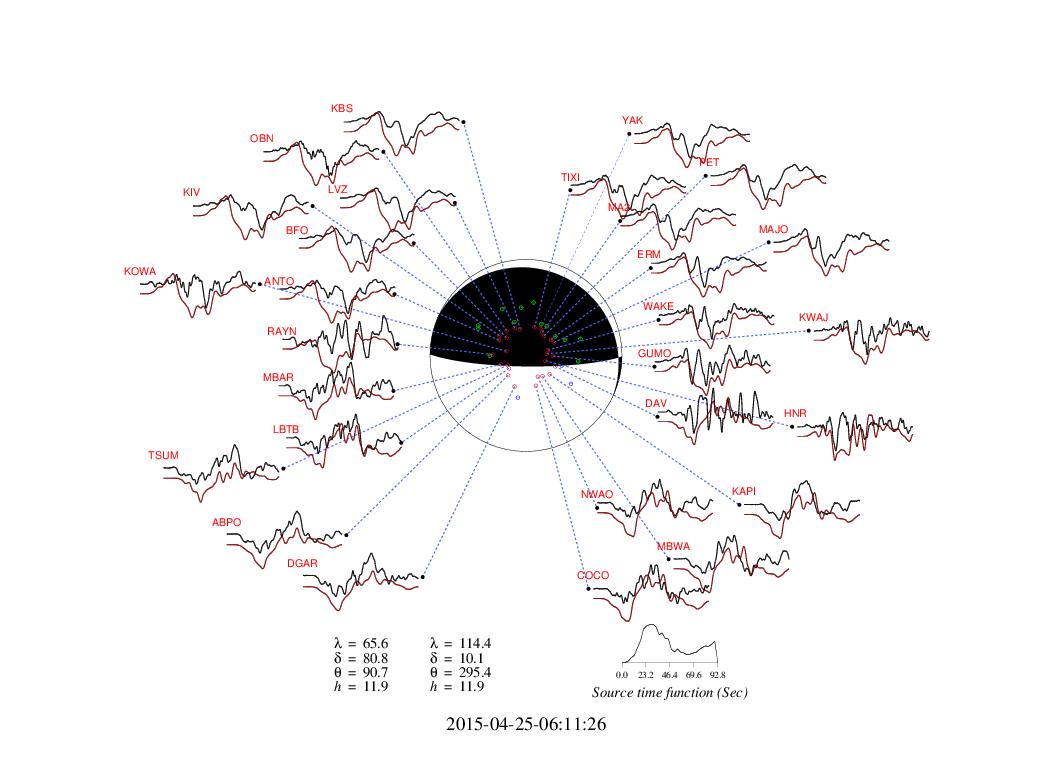
Figure 1 Focal mechanism of the Mw7.9 earthquake, Nepal. Lower-hemisphere projection is used here. The observed P wave records (black line) and the synthetic seismogram (red line) based on the simple point model are compared. The parameters of two possible fault planes are listed also, with l, d, q ,h indicating the rake angle, dip angle, strike direction and source depth respectively. The obtained source time function are plotted. ITP staff Dr. WANG Weimin and his colleagues at Institute of Geology and Geophysics downloaded broadband waveforms from the IRIS immediately after the earthquake. They selected 28 teleseismic broadband P waveforms and 27 broadband SH waveforms based on data quality and azimuthal distribution to determine the focal mechanism (Fig. 2). 
Figure 2 Comparison of the observed teleseismic P and SH records with the synthetic waveforms. Comparison of observed (black) and synthetic waveforms (red) for P vertical components, and SH components are shown in the panel, the azimuth, epicentral distance, amplitude ratio and station name are also indicated. A fault model with epicenter depth of 12 km constrained by the focal mechanism was constructed, and the source rupture process of this earthquake was determined by a finite fault inverse algorithm. According to their preliminary results, the source rupture propagated unilaterally along a low dip angle thrust fault with source duration about 80s (Fig. 3).

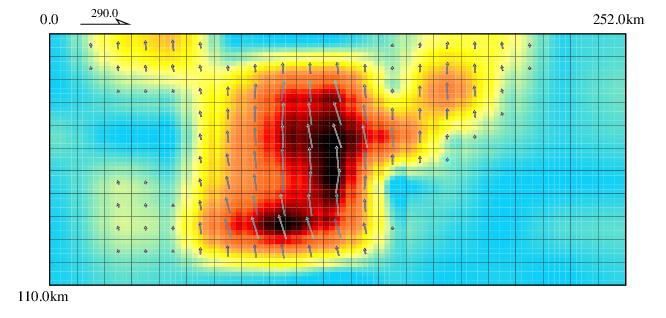
Figure 3 Inverted slip distribution on the fault. Surface projection of fault model ( up-left ) and 3D view of the fault model ( up-right ) are shown 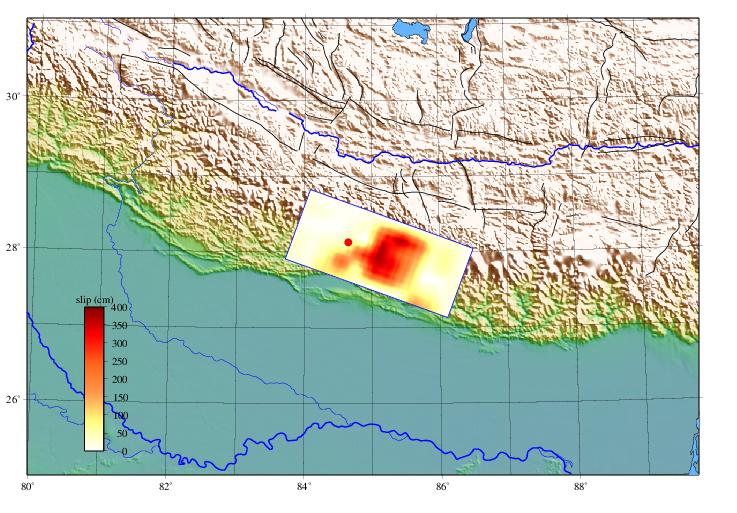
Fig. 4 The map shows the projection of slip distribution on the ground Their analysis based on this model also showed the seismic moment release as ~7.86×10²⁰ Nm with a 375cm max slip, and the magnitude as about Mw7.9 (Fig. 4). The shakemap of this event scaled by China Intensity Table (2008) was also estimated based on the preliminary source model. |
|